Designing a customer effort score framework for the Utility Warehouse app
The challenge
Utility Warehouse runs several digital journeys at once (switching a customer’s broadband, ordering a new SIM, setting up a direct debit, raising a support request) and every product team had its own idea of whether those journeys were actually easy to use. There was no shared, ongoing way to measure customer effort across the app, only the risk of each team bolting on its own one-off survey.
Left alone, that risk is a real cost: ask customers for feedback too often, in too many disconnected ways, and the feedback itself becomes a source of effort and irritation. The brief was to design a single, coherent Customer Effort Score (CES) framework, sometimes referred to internally as a Digital Effort Score, that any team could plug a journey into, with a consistent survey mechanism, a shared scoring model, and rules for when a customer should (and shouldn’t) be asked.
The initiative sat under a wider “Digital Ease Measurement” workstream, with a clear top-line target: measure and increase Customer Effort Score for digital interactions by 25%, giving the business a credible way to prioritise fixes and prove the experience was actually improving over time.
Defining the problem before designing the solution
Before any screens were drawn, the work started with the questions a measurement framework lives or dies on: what, exactly, are we trying to find out, from whom, and why does it matter to the business? That meant setting out the hypothesis, the objectives, clear success criteria and, critically, a method for identifying which journeys were worth measuring first, rather than trying to instrument everything on day one.
A simple decision framework captured how a feedback request should actually get triggered:
- Customer does something worth knowing about: a self-serve form, an existing-customer interaction, a new sign-up.
- Category of thing: which kind of service and customer relationship it sits under.
- Type of feedback request: a post-support call, an onboarding journey, a self-serve form, or something else.
- Context: did the customer complete it successfully, start and abandon it, or something in between?
- Feedback request history: has this customer already been asked recently? Rules here stop any one customer being pestered by multiple teams.
- Decision: send the request now, queue it for later, or don’t send it at all.
That last point mattered as much as any individual survey design: the framework had to work for the whole customer journey rather than the slice one team cared about, and it had to actively prevent feedback fatigue rather than leave it to chance.
Designing the survey itself
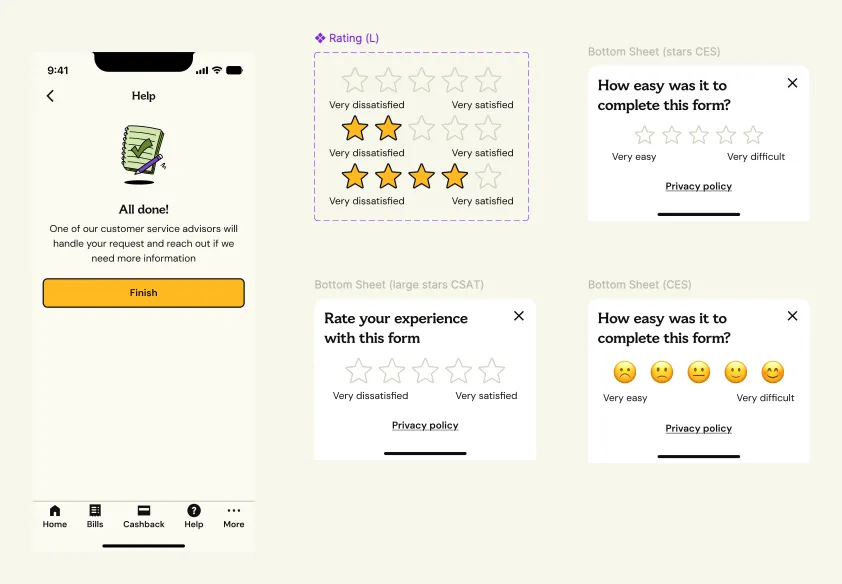
With the measurement principles agreed, the next phase was the survey mechanism customers would actually see. Several question formats were explored side by side: a numbered 1–7 scale (the traditional CES format), a Likert agreement scale, a 5-star rating, an emoticon scale, and a simple binary thumbs up/down, each weighed against how quickly a customer could answer on a phone screen, how much nuance it captured, and how well it would hold up across very different journey types, from a quick SIM order to a multi-step broadband switch. The two mockups below are concept explorations from that phase, not final shipped UI. See “The finished in-app journey” further down for how the mechanism actually ended up looking once built.
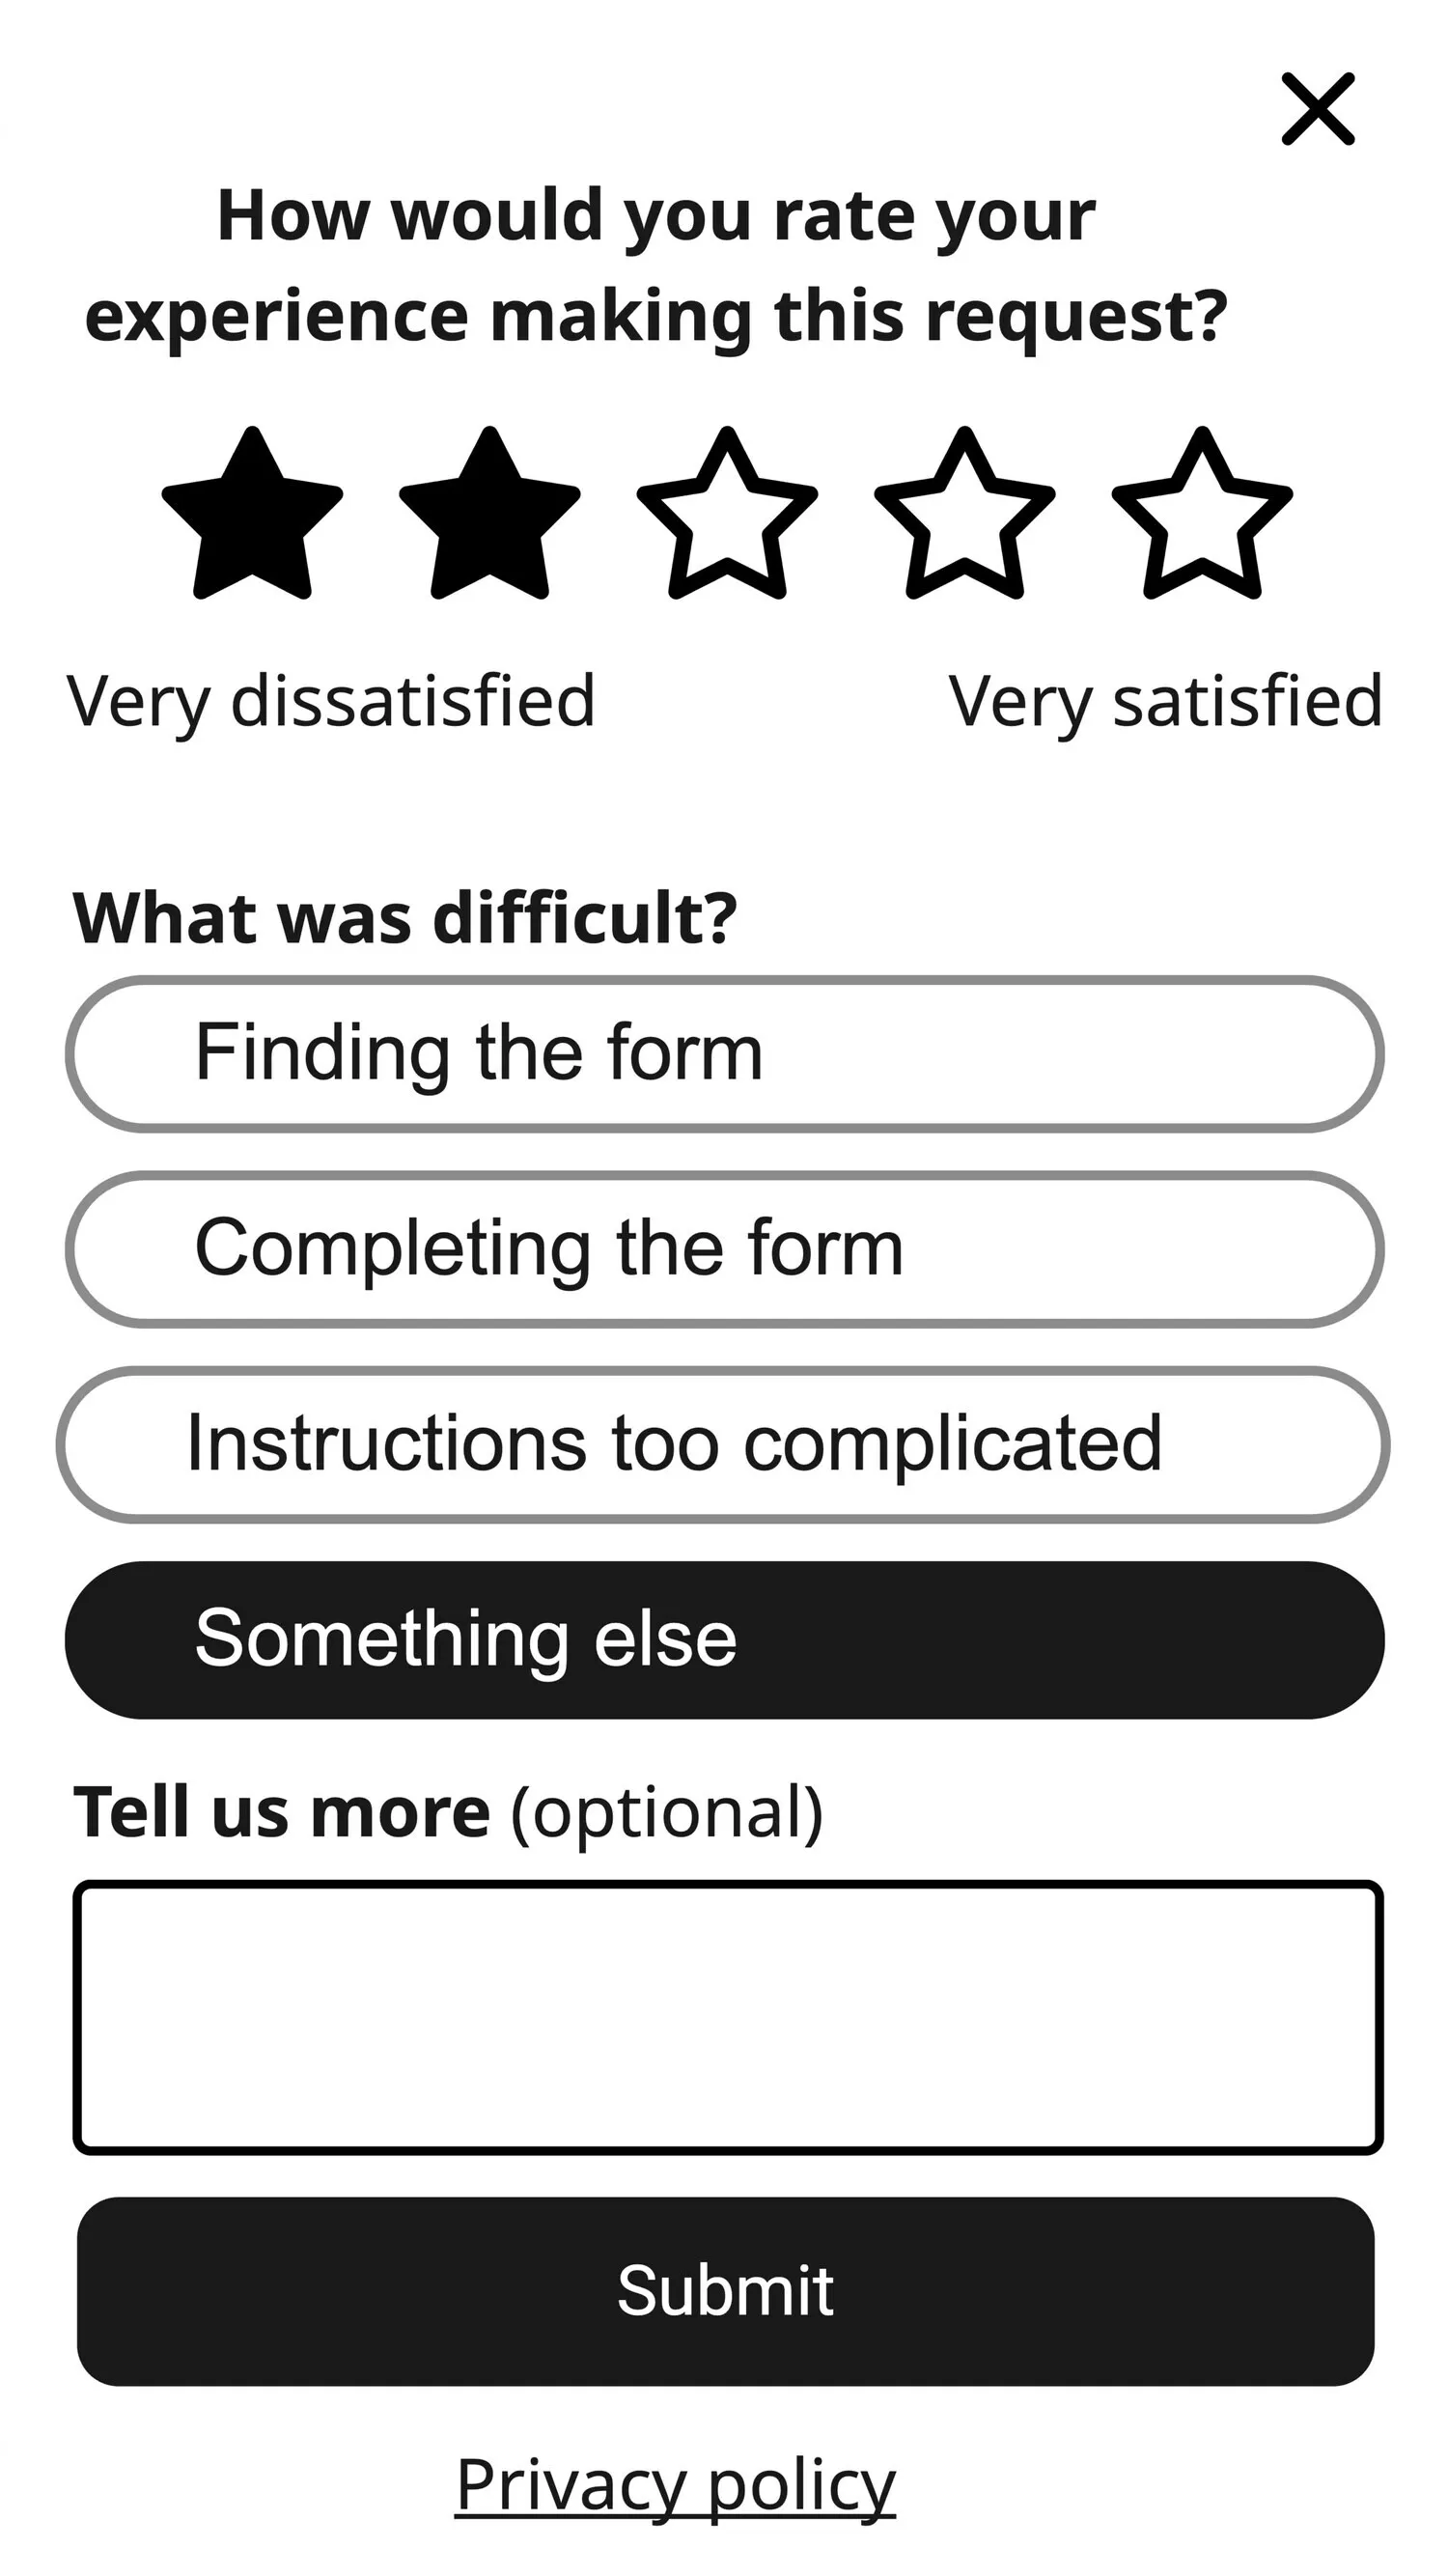
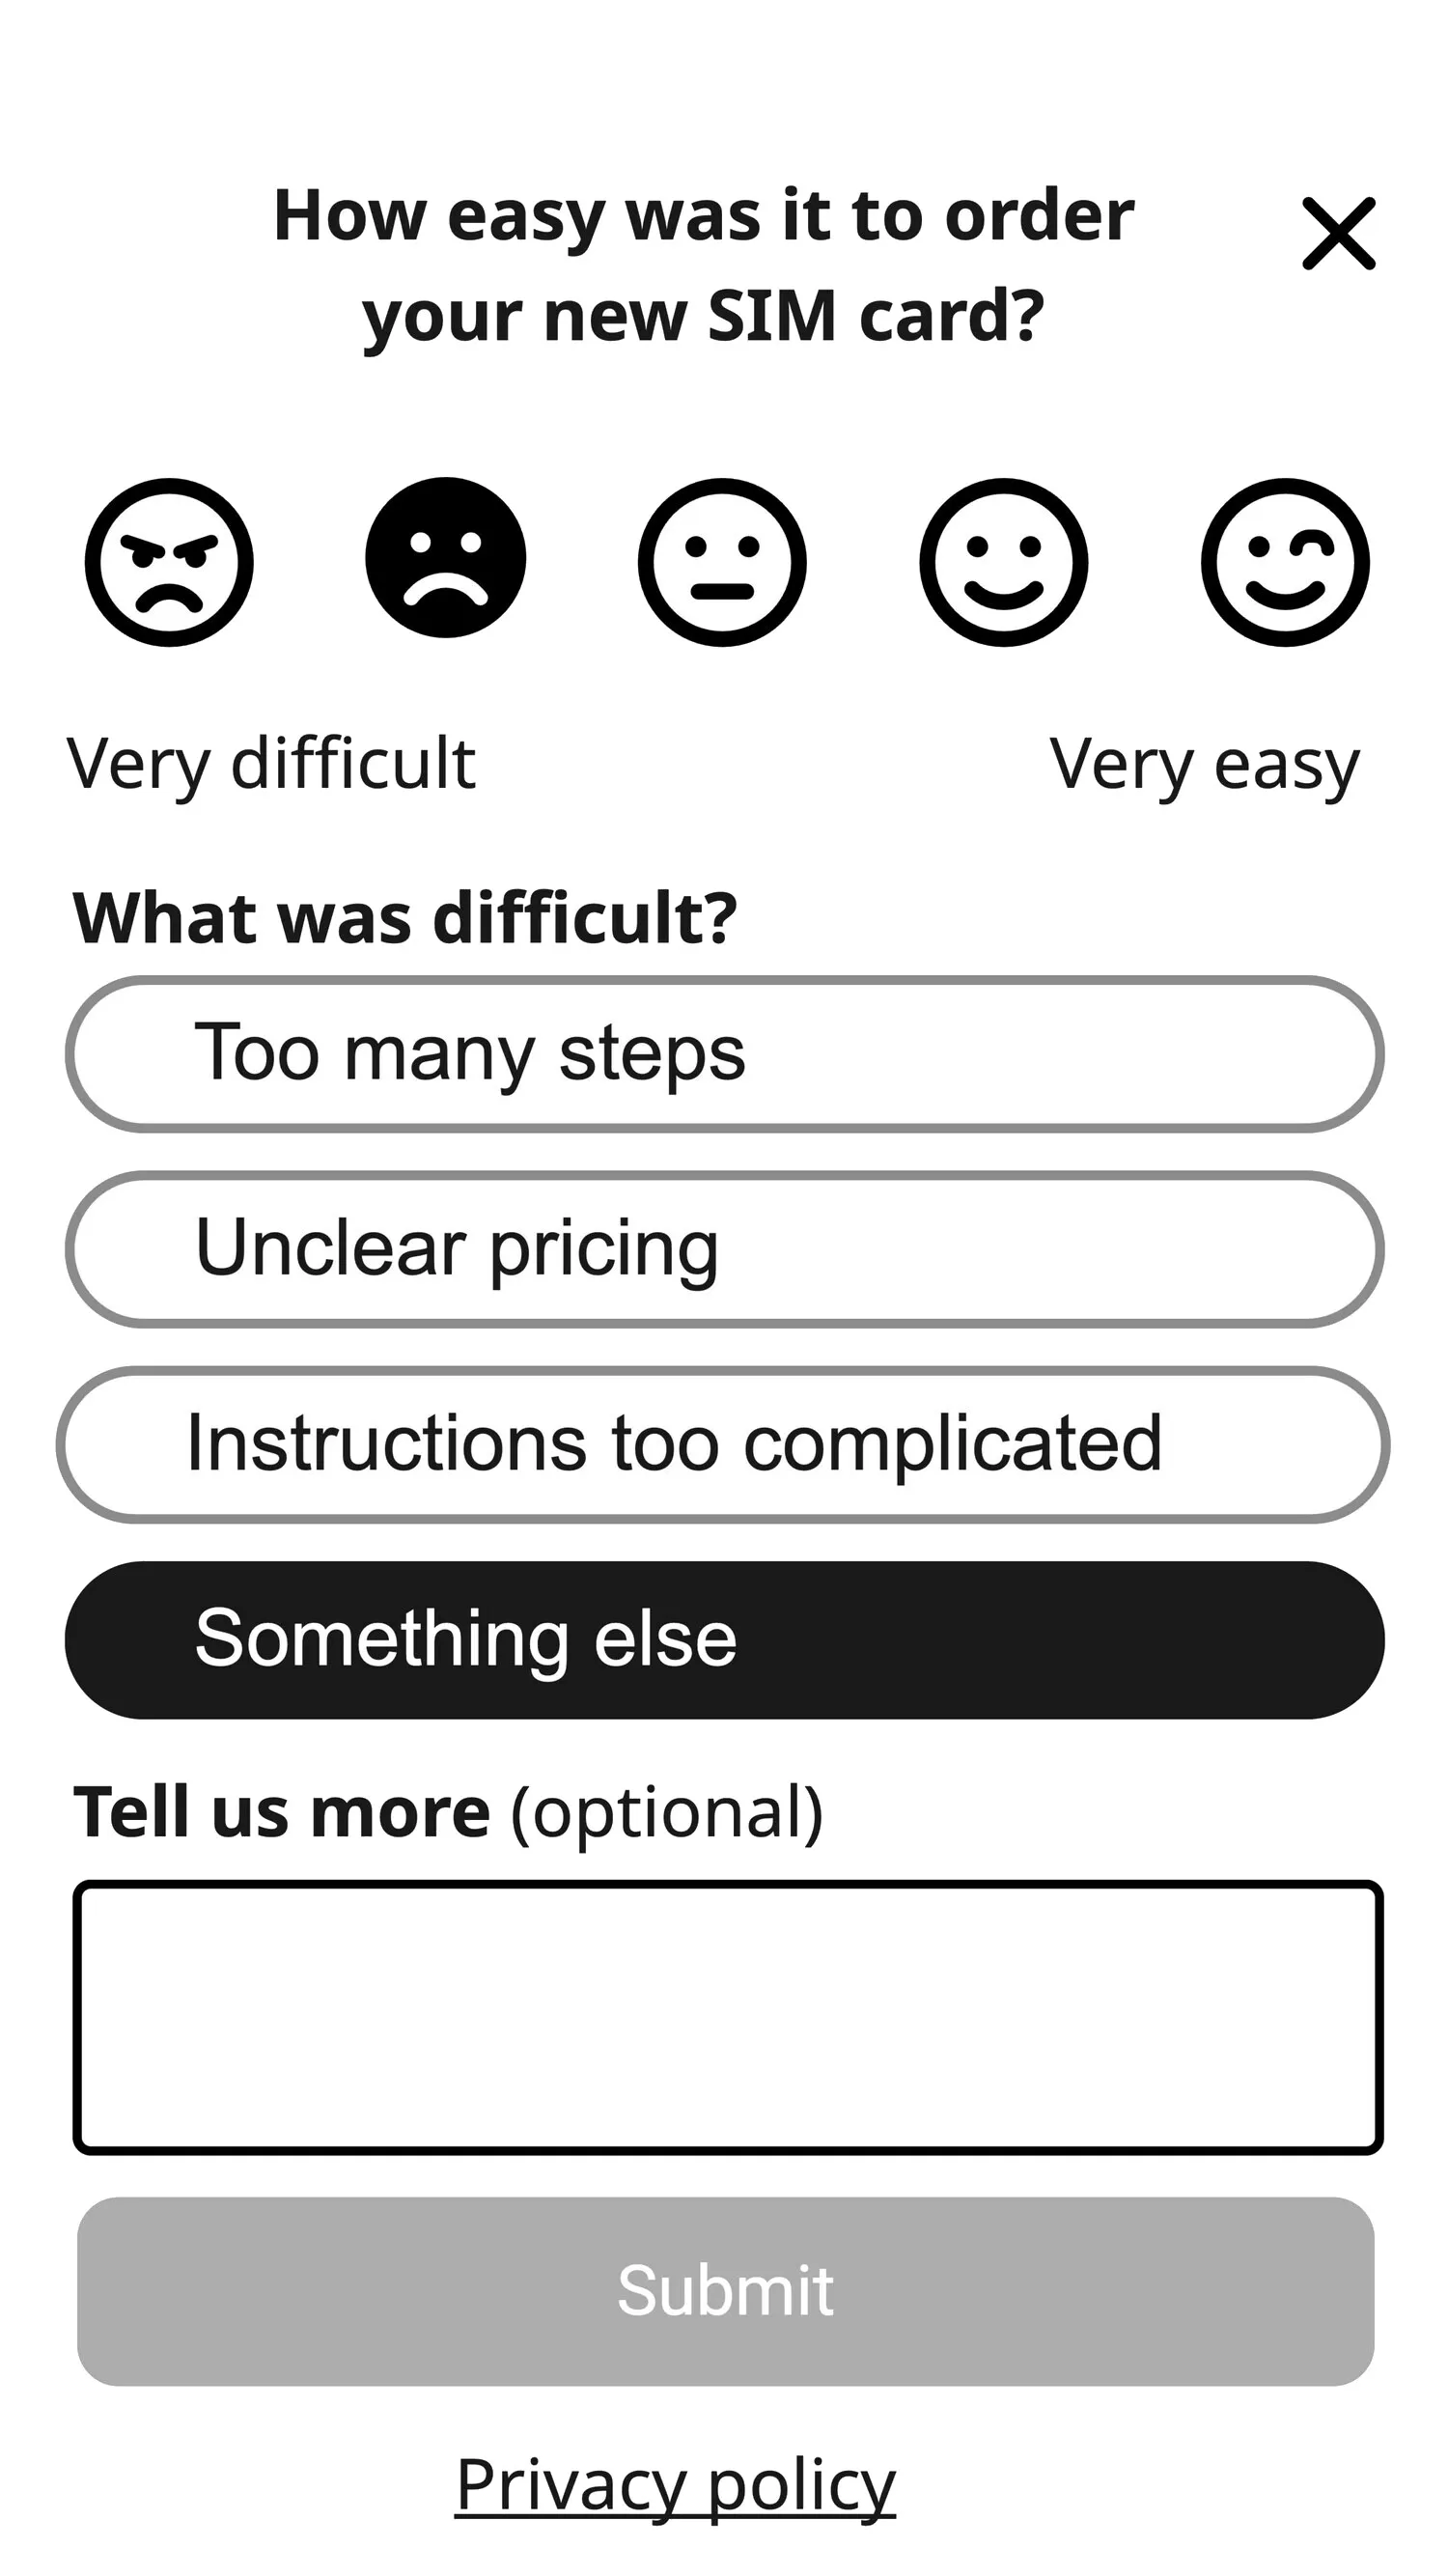
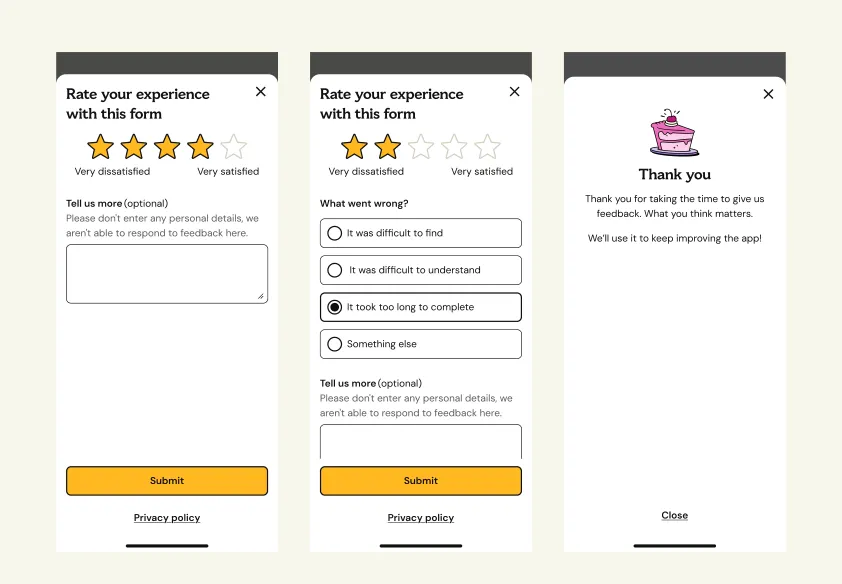
A consistent follow-up pattern sits behind every scale format shown above: a low or middling score always triggers a lightweight “what went wrong?” question (difficulty finding the form, difficulty understanding it, too many steps, or something else), plus an optional free-text field. That’s what turns a CES number into something a product team can actually act on, rather than a score with no explanation attached.
In-context feedback, not a delayed survey
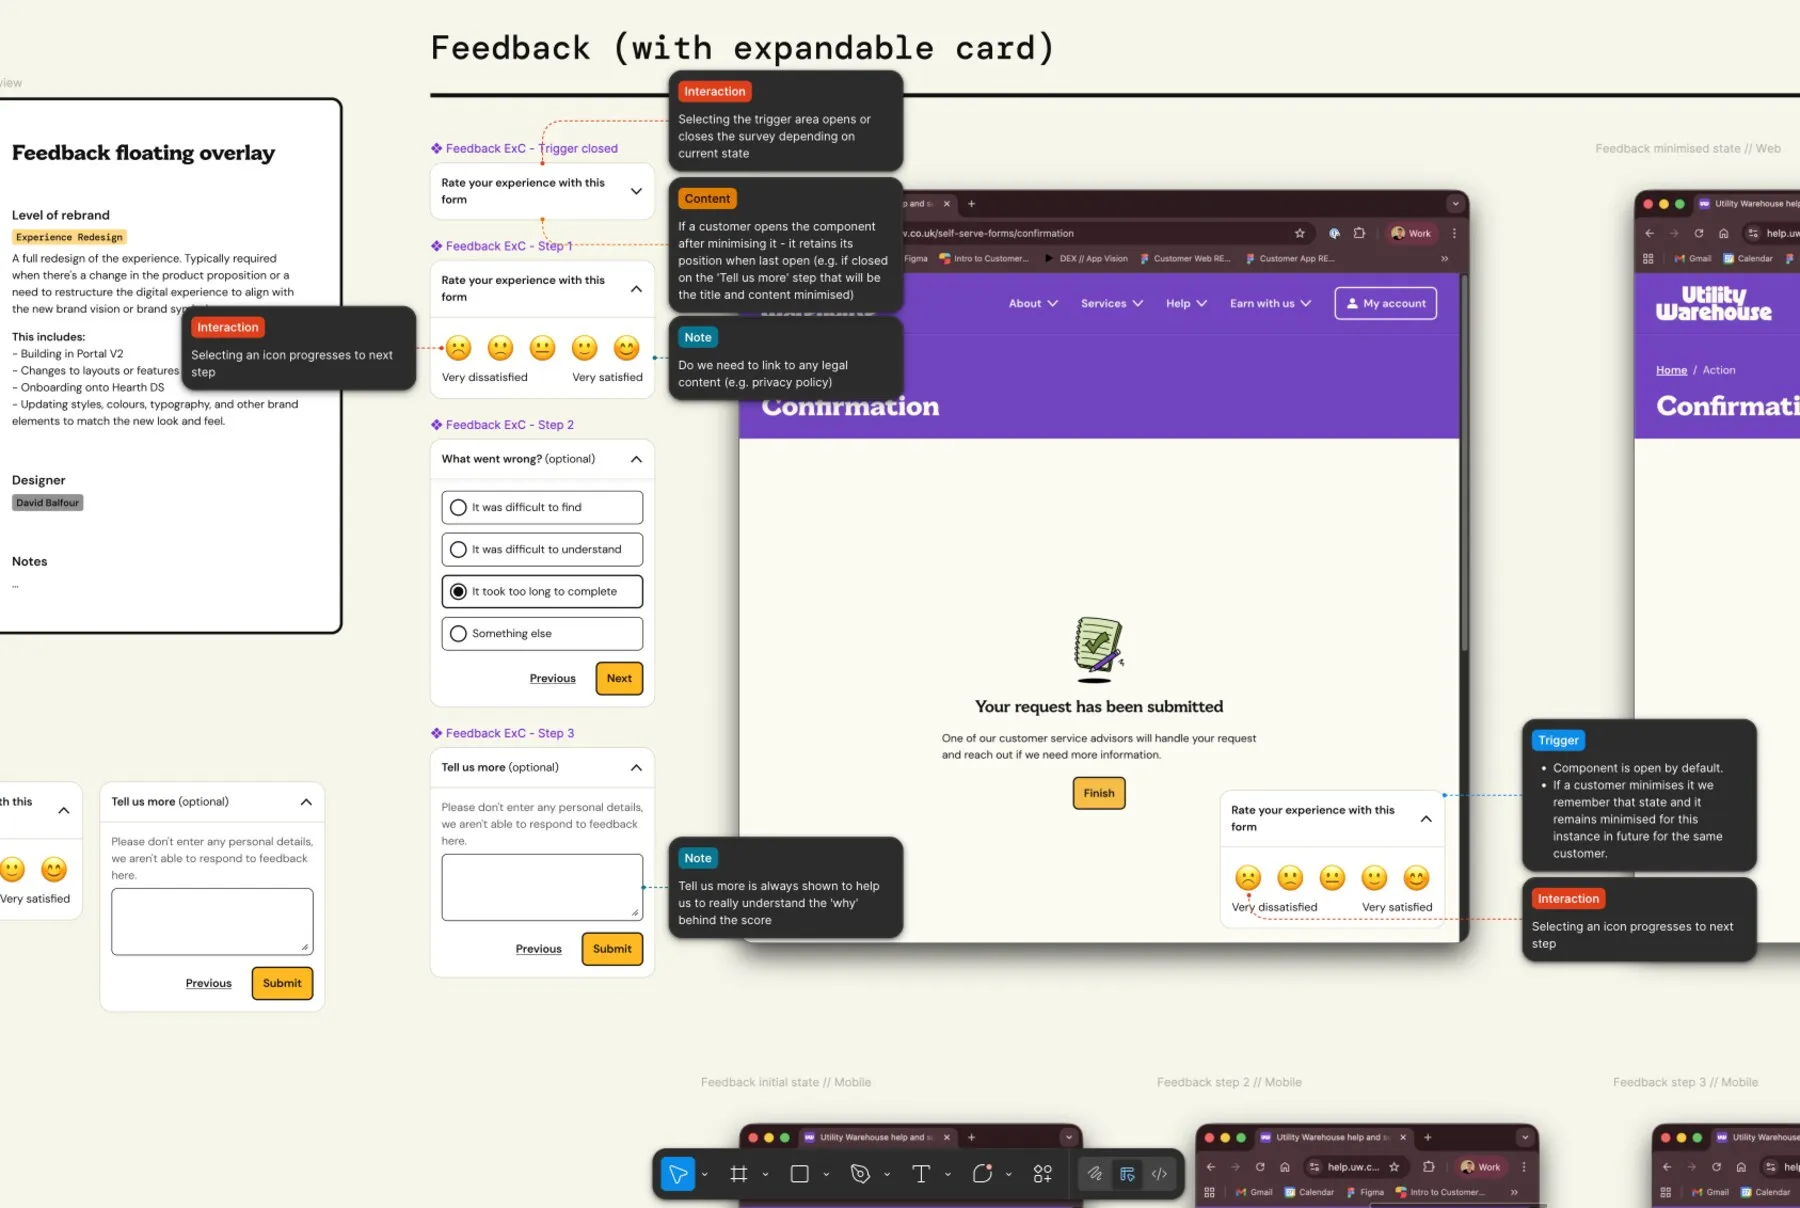
The most important design decision in the whole project was when to ask. Rather than a generic, delayed survey email days after the fact, the framework places the feedback prompt at the moment a task completes, while the effort involved is still fresh in the customer’s mind. A trigger strategy distinguished between automatic triggers (the system detects a completed or abandoned journey and surfaces the prompt itself) and user-initiated triggers (a customer opts in to give feedback, for example from a “was this helpful?” link), with clear rules for which journeys should use which.
This extended to designing the component as a true, reusable piece of UI rather than a one-off screen. The feedback card needed defined states (open, minimised, closed), had to remember where a customer left off if they minimised it partway through, and had to behave consistently whether it appeared on the web journey or inside the app.
The finished in-app journey
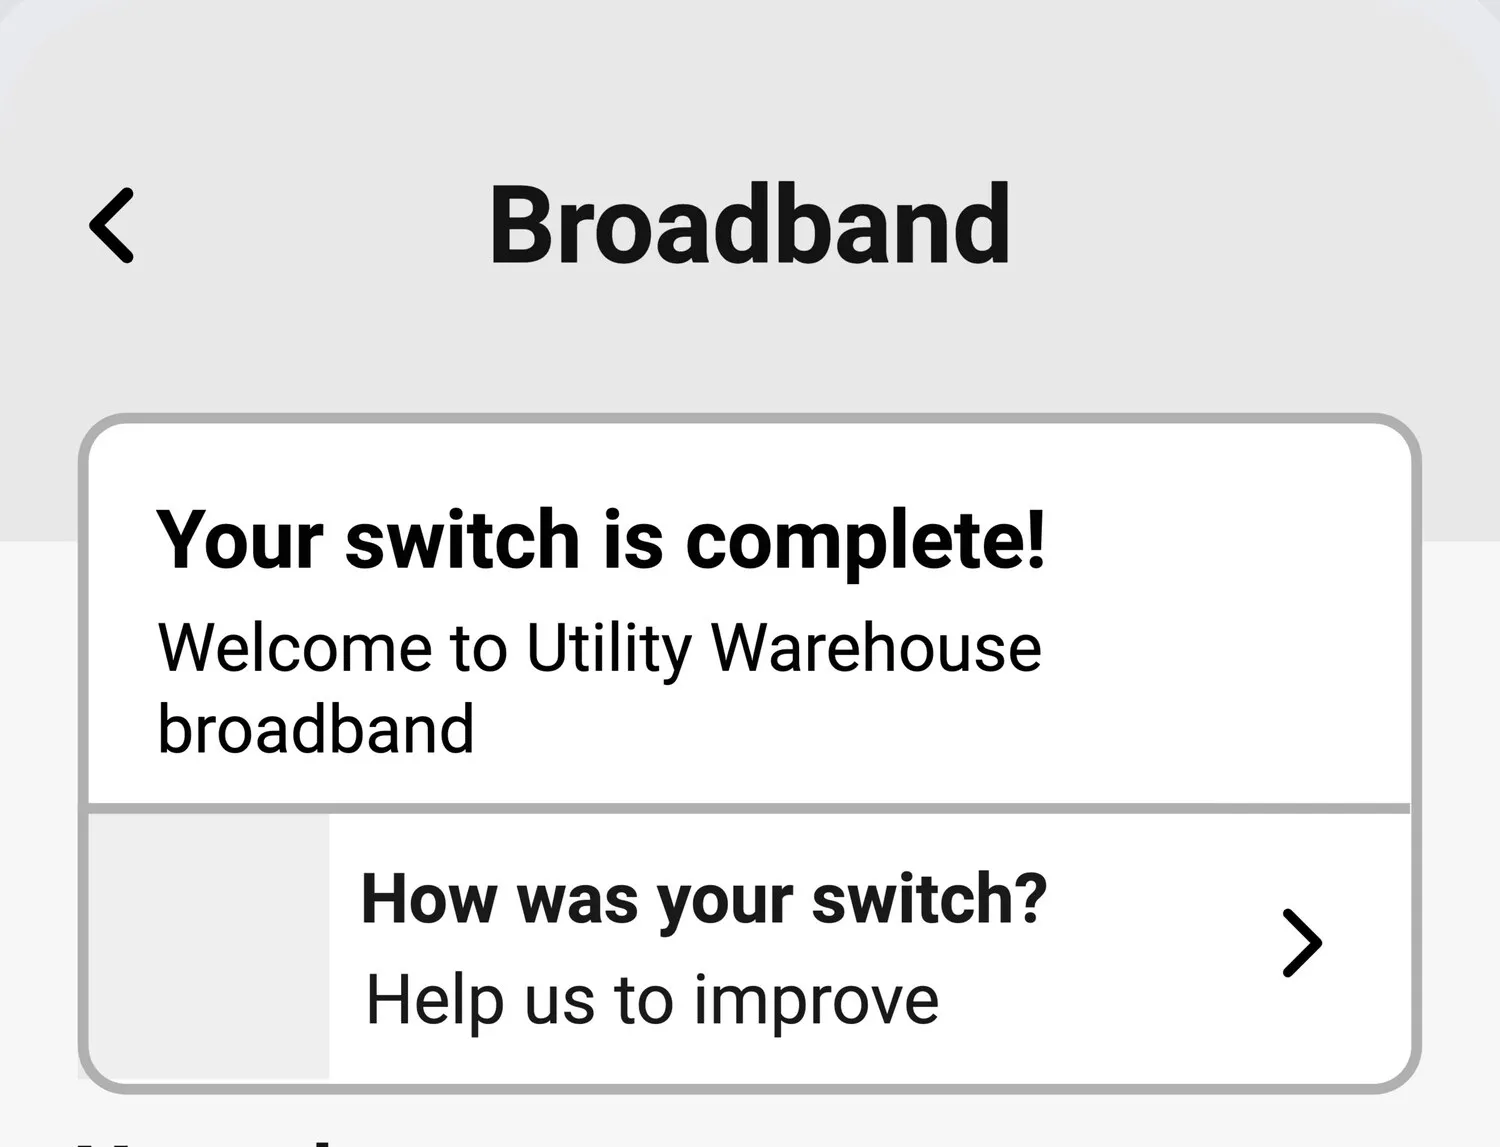
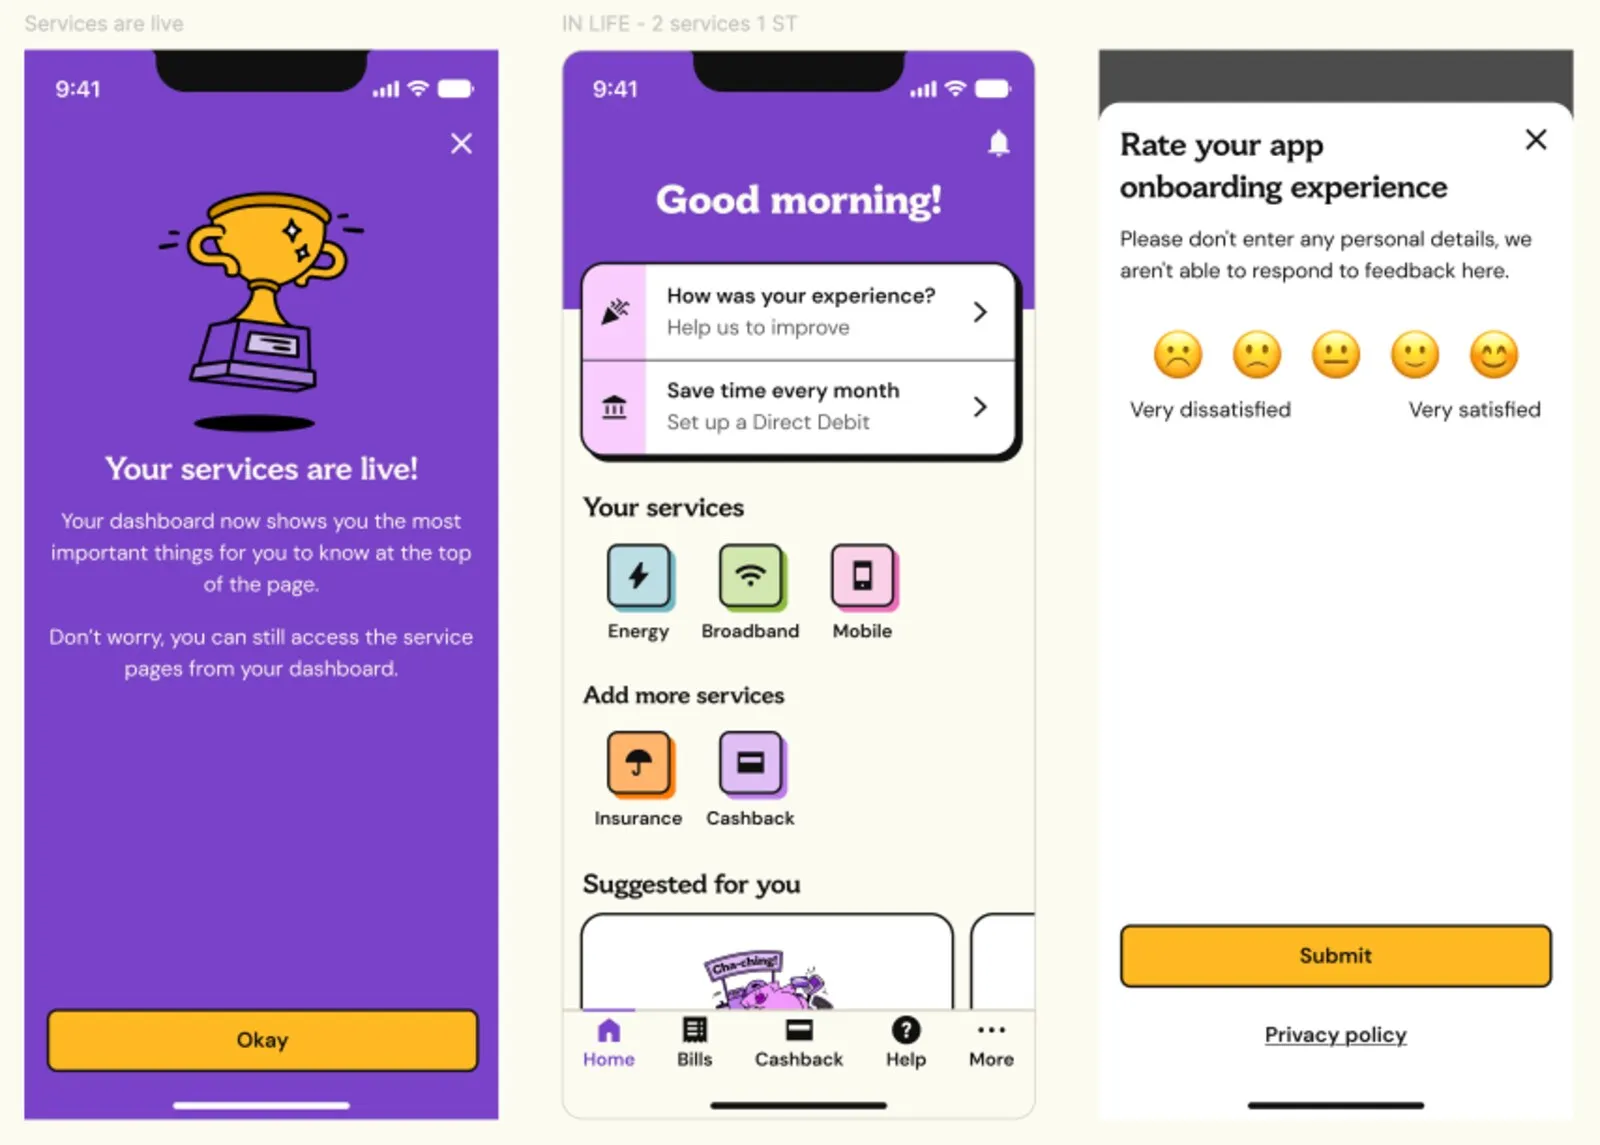
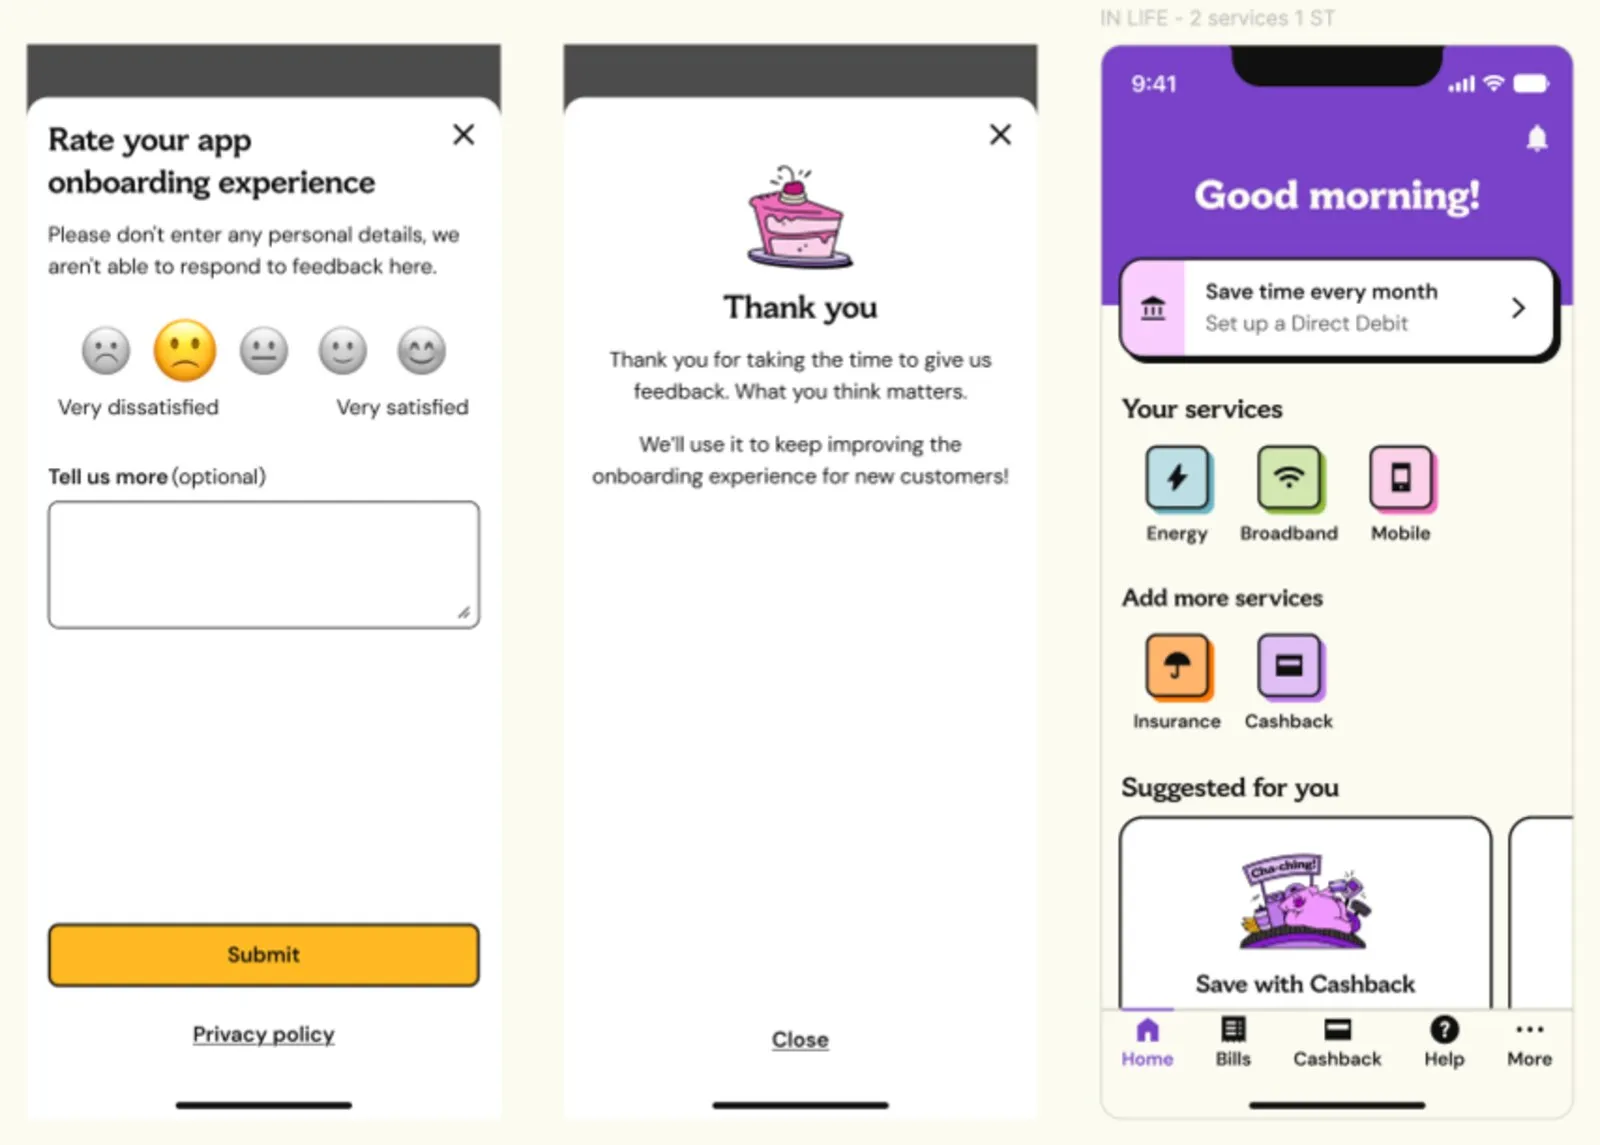
Rather than a blocking pop-up, the shipped entry point sits quietly on the home screen as a dismissible card alongside other prompts: a deliberately low-pressure version of the “ask at the right time” principle, giving a customer the option to give feedback without interrupting whatever they came to the app to do.
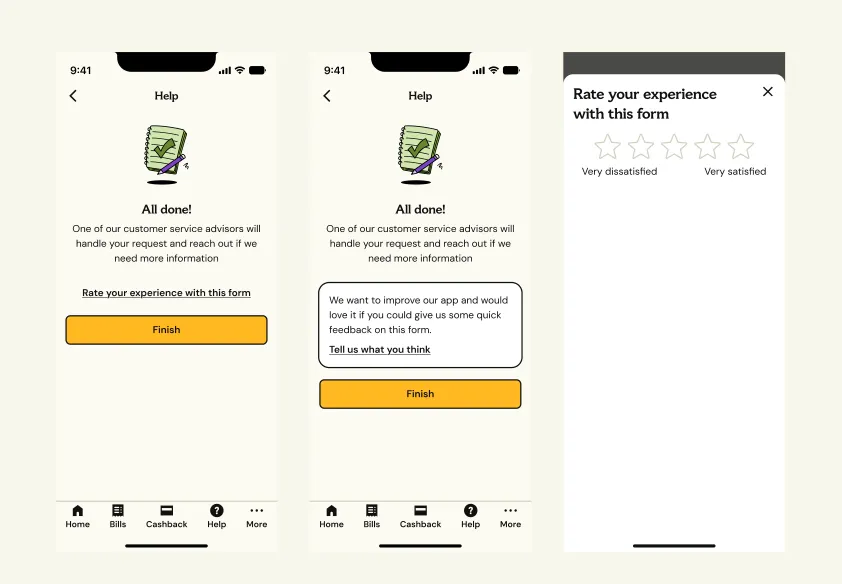
The same mechanism was designed for the self-serve Help forms. Once a request is sent, the “All done!” screen offers a light “Rate your experience with this form” link rather than an interruption; a rating opens a bottom sheet with an optional “what went wrong?” follow-up, then a short thank-you. Alongside the screens sits the component set: a star rating at three sizes, and bottom sheets for a star CES, a larger star CSAT and an emoji CES, so every team builds from the same parts.
From scores to action: prioritisation and continuous improvement
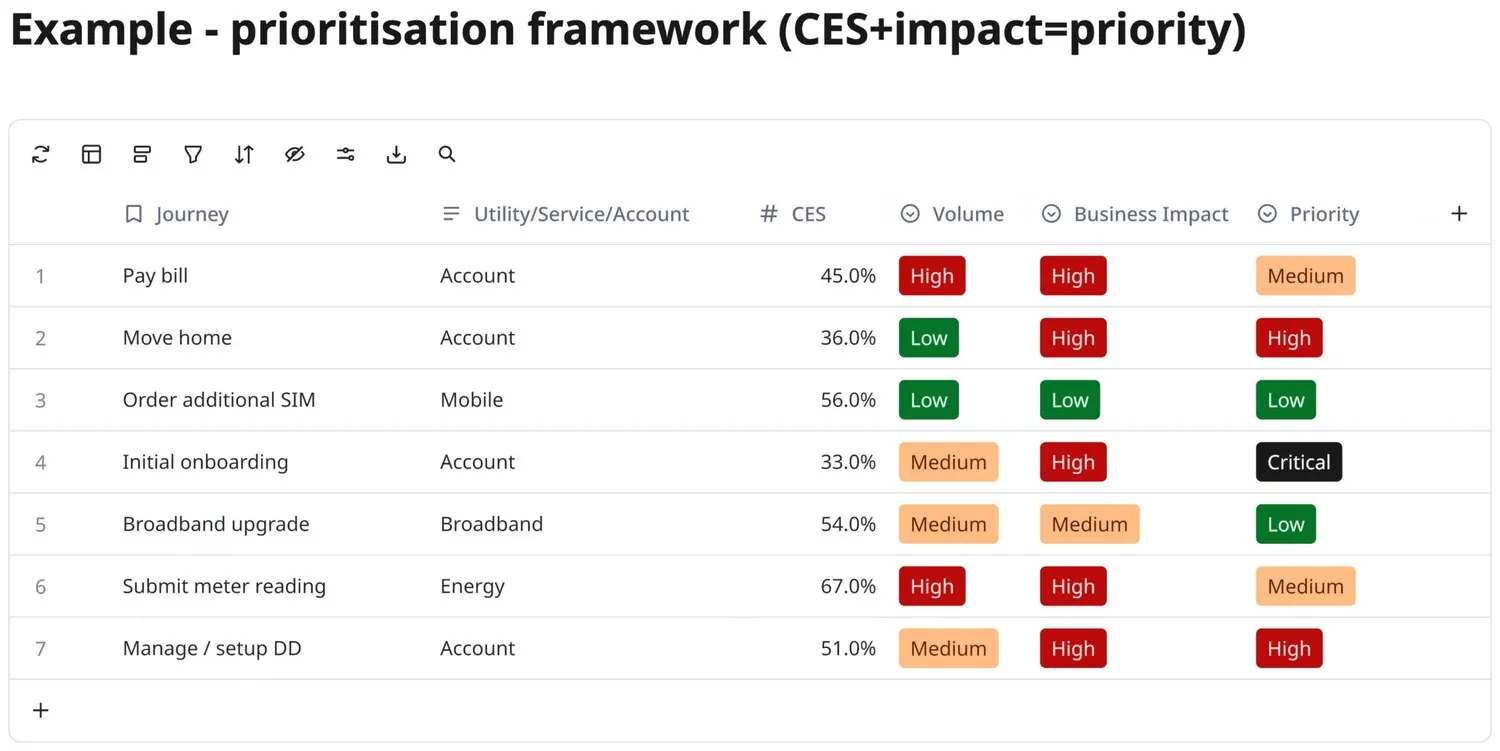
A Customer Effort Score is only useful if it changes what a team works on next. Two frameworks were designed to close that loop:
- MeasureCES and analytics
- DiagnoseQuantitative and qualitative insights
- FixDesign UX improvements
- TestA/B or usability testing
- Re-measureCES again, to confirm the change
Then back to Measure
An admin-facing feedback dashboard concept was also scoped alongside the customer-facing mechanism, so the people acting on the data weren’t left combing through raw survey responses. The concept let the team search feedback by customer, by journey category, or by specific feedback request, with an aggregate CES calculated automatically as the mean score across all respondents for that journey, giving product teams one shared source of truth instead of each team keeping its own spreadsheet.
The target
The framework was built against a clear goal: closing the gap between current effort scores and a 25% improvement target, giving Utility Warehouse a concrete benchmark to design and prioritise against, and a rollout plan to get there in phases rather than instrumenting every journey at once, starting with the highest-priority journeys identified by the framework above, then expanding coverage once the survey mechanism, trigger rules and dashboard had proven themselves on real traffic.
← Back to all case studies